EX-99.2
Published on November 18, 2025
| Ardagh Metal Packaging Investor Presentation November 2025 |
| 1 THIS PRESENTATION IS NOT FOR RELEASE, PUBLICATION OR DISTRIBUTION, IN WHOLE OR IN PART, IN ANY JURISDICTION WHERE SUCH RELEASE, REPRODUCTION, PUBLICATION OR DISTRIBUTION WOULD BE UNLAWFUL OR TO ANY OTHER PERSON. THIS PRESENTATION DOES NOT CONTAIN ALL OF THE INFORMATION THAT IS MATERIAL TO AN INVESTOR AND SHOULD NOT FORM THE BASIS OF ANY INVESTMENT DECISION. The purpose of this Presentation is to provide an overview of Ardagh Metal Packaging S.A. and its subsidiaries (collectively, the "Group"). For the purposes of this notice, “Presentation” collectively means this document, its contents or any part of it. This Presentation has been prepared and issued by and is the sole responsibility of the Group and is being furnished to each recipient solely for informational purposes and has not been independently verified. Save as set out below, this Presentation has been prepared by the Group on the basis of information in its possession, as well as from sources believed to be reliable. The information contained in this Presentation, which does not purport to be comprehensive, has not been independently verified by or on behalf of Group. This Presentation does not constitute an audit or due diligence review and should not be construed as such. No reliance should be placed on the data herein, which may be subject to change without notice. The distribution of this Presentation in other jurisdictions may be restricted by law, and persons into whose possession this Presentation comes must inform themselves about, and observe, any such restrictions. Neither the Group, nor any of its affiliates, advisors or representatives, nor any of their respective directors, officers, employees, agents, advisers, partners or firm personnel accepts any responsibility, obligation or liability whatsoever for, or makes any representation or warranty, express or implied, as to, and no reliance should be placed on, the fairness, truth, fullness, accuracy, completeness or correctness of, the information in this Presentation, whether any information has been omitted from this Presentation, or as to any other information relating to the Group, whether written, oral or in a visual or electronic form, and howsoever transmitted or made available, or for any loss howsoever arising from any use of this Presentation or its contents or otherwise arising in connection therewith. No representation or warranty, express or implied, is given by or on behalf of the Group any of their affiliates, or any of such person’s respective directors, officers, employees, agents or advisers as to, and no reliance should be placed on, the fairness, accuracy, completeness or correctness of the information or opinions contained in this Presentation or otherwise made available, nor as to the reasonableness of any information contained herein or therein. No responsibility or liability (including in respect of direct, indirect or consequential loss or damage) is assumed by any such persons for such information or opinions or for any errors or omissions. Except where otherwise indicated in this Presentation, the information provided therein is based on matters as they exist at the date of preparation of this Presentation and not as of any future date, and will be subject to updates, revisions, verification and amendments without notice, which may result in any such information changing materially. Neither the Group or any of their affiliates, nor any of such person’s respective directors, officers, employees, agents, advisers, partners or firm personnel is under an obligation to update or keep current the information contained in this Presentation, to provide the recipient with access to any additional information, or to correct any inaccuracies in this Presentation that may arise in connection with it, and any opinions expressed in this Presentation are subject to change without notice. Nothing contained in this Presentation is or should be relied upon as a promise or representation as to the future. This document has not been reviewed or approved by any regulatory or supervisory authority. The information contained in this Presentation may include results of analyses from a quantitative model that may represent potential future events that may or may not be realized and is not a complete analysis of every material fact relating to the Group or its business. The industry, market and competitive position data contained in this Presentation has come from third party sources as well as certain studies and analyses prepared by other independent consultants or other publicly available sources. Third party industry publications, studies and surveys generally state that the data contained therein has been obtained from sources believed to be reliable. Nevertheless, there is no guarantee of the accuracy or completeness of such data. In addition, certain of the industry, market and competitive position data contained in this Presentation comes from the Group's own internal research and estimates based on the knowledge and experience of the Group's management in the market in which the Group operates. While the Group believes that any such research and estimates are reasonable and reliable, their underlying methodology and assumptions have not been verified by any independent source for accuracy or completeness and are subject to change without notice. Accordingly, undue reliance should not be placed on any of the industry or market data contained in this Presentation. Investors are urged to make their investment decisions based on their own determination and analysis of industry and market data. This Presentation does not purport to give legal, tax, regulatory, accounting, investment or financial advice, or a personal recommendation. No part of this presentation, nor its distribution, should be taken as constituting investment advice and it is not intended to provide, and must not be taken as, the basis of any decision and should not be considered as a recommendation to acquire any securities of the Group. This Presentation includes statements that are, or may be deemed to be, “forward looking statements.” These forward -looking statements can be identified by the use of forward-looking terminology, including the terms “believes,” “estimates,” “anticipates,” “expects,” “intends,” “plans,” “may,” “will,” “would” or “should,” or, in each case, their negative or other variations or comparable terminology. These forward-looking statements include all matters that are not historical facts. They appear in a number of places and include, but are not limited to, statements regarding the Group’s intentions, beliefs or current expectations concerning, amongst other things, results of operations, financial condition, liquidity, capital expenditure, prospects, growth and strategies. By their nature, forward-looking statements involve risks and uncertainties because they relate to events and depend on circumstances that may or may not occur in the future. Forward looking statements are not guarantees of future performance and the actual results of operations, financial condition and liquidity, and the development of the industry in which the Group operates, may differ materially from those made in or suggested by the forward-looking statements set out in this Presentation. Past performance of the Group cannot be relied on as a guide to future performance. Forward-looking statements speak only as at the date of this Presentation and each member of the Group, and any of its affiliates, directors, officers, employees, agents, advisers, partners and firm personnel expressly disclaims any obligations or undertaking to release any update of, or revisions to, any forward-looking statements in this Presentation. No statement in this Presentation is intended to be a profit forecast. As a result, recipients are cautioned not to place any undue reliance on such forward-looking statements. In addition, even if the results of operations, financial condition and liquidity of the Group, and the development of the industry in which the Group operates, are consistent with the forward-looking statements set out in this Presentation, those results or developments may not be indicative of results or developments in subsequent periods. For a more detailed description of the main risks and uncertainties that could cause actual results to differ materially from those expressed or implied by forward-looking statements, please refer to the Group’s quarterly and annual financial statements, which can be found on the Group’s website at https://ir.ardaghmetalpackaging.com/sec-filings/annual-reports. This Presentation contains, and any related presentation may contain, financial information regarding the businesses and assets of the Group. Such financial information may not have been audited, reviewed or verified by any independent accounting firm. The inclusion of such financial information in this Presentation should not be regarded as a representation or warranty by the Group or any of its affiliates, advisors or representatives as to the fairness, accuracy, correctness, reasonableness or completeness of such information’s portrayal of the financial condition or results of operations by the Group and should not be relied upon. The unaudited condensed consolidated interim financial statements of the Group as of and for the three and nine -month period ended September 30, 2025 (nine-month period ended September 30, 2024) are unaudited. In addition, certain financial data included in the Presentation would constitute “non-IFRS financial measures”. The non-IFRS financial measures, have not been audited or reviewed in accordance with any generally accepted auditing standards and are subject to change. Certain figures contained in this Presentation, including financial information, have been subject to rounding adjustments. Accordingly, in certain instances, the sum or percentage change of the numbers contained in this Presentation may not conform exactly to the total figure given. The disclosure of non-IFRS financial measures in the manner included in the Presentation would not be permissible in a registration statement under the Securities Act. These non-IFRS financial measures do not have a standardized meaning prescribed by IFRS and therefore may not be comparable to similarly titled measures presented by other entities, nor should they be construed as an alternative to other financial measures determined in accordance with IFRS. Although the Group believes these non-IFRS financial measures provide useful information in measuring the financial performance and condition of the business, recipients are cautioned not to place undue reliance on any non-IFRS financial measures and ratios included in this Presentation. Disclaimer |
| 2 1 2 3 Business Overview Historical Financials Key Investment Highlights 4 Appendix Today’s Agenda Request: updated photos for TOC and Flysheets |
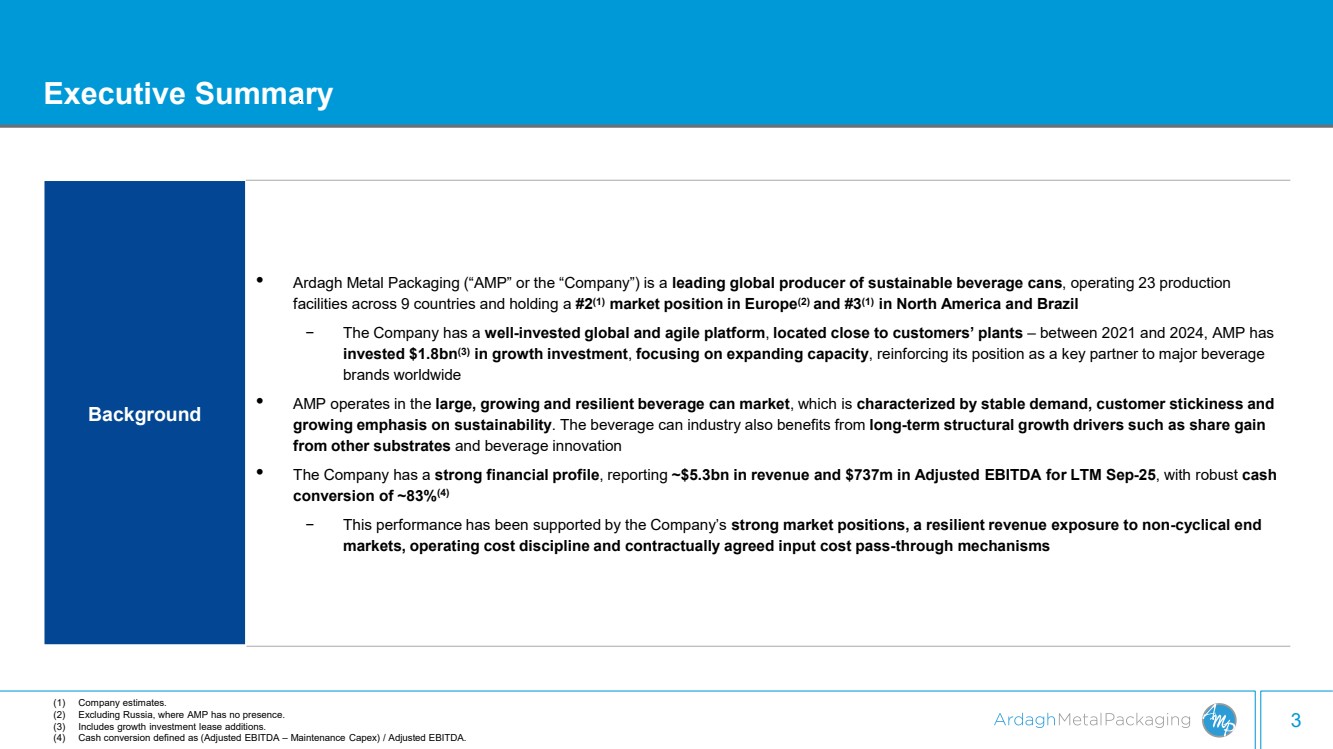
| 3 Executive Summary Background • Ardagh Metal Packaging (“AMP” or the “Company”) is a leading global producer of sustainable beverage cans, operating 23 production facilities across 9 countries and holding a #2(1) market position in Europe(2) and #3(1) in North America and Brazil − The Company has a well-invested global and agile platform, located close to customers’ plants – between 2021 and 2024, AMP has invested $1.8bn(3) in growth investment, focusing on expanding capacity, reinforcing its position as a key partner to major beverage brands worldwide • AMP operates in the large, growing and resilient beverage can market, which is characterized by stable demand, customer stickiness and growing emphasis on sustainability. The beverage can industry also benefits from long-term structural growth drivers such as share gain from other substrates and beverage innovation • The Company has a strong financial profile, reporting ~$5.3bn in revenue and $737m in Adjusted EBITDA for LTM Sep-25, with robust cash conversion of ~83%(4) − This performance has been supported by the Company’s strong market positions, a resilient revenue exposure to non-cyclical end markets, operating cost discipline and contractually agreed input cost pass-through mechanisms (1) Company estimates. (2) Excluding Russia, where AMP has no presence. (3) Includes growth investment lease additions. (4) Cash conversion defined as (Adjusted EBITDA – Maintenance Capex) / Adjusted EBITDA. |
| 1. Business Overview |
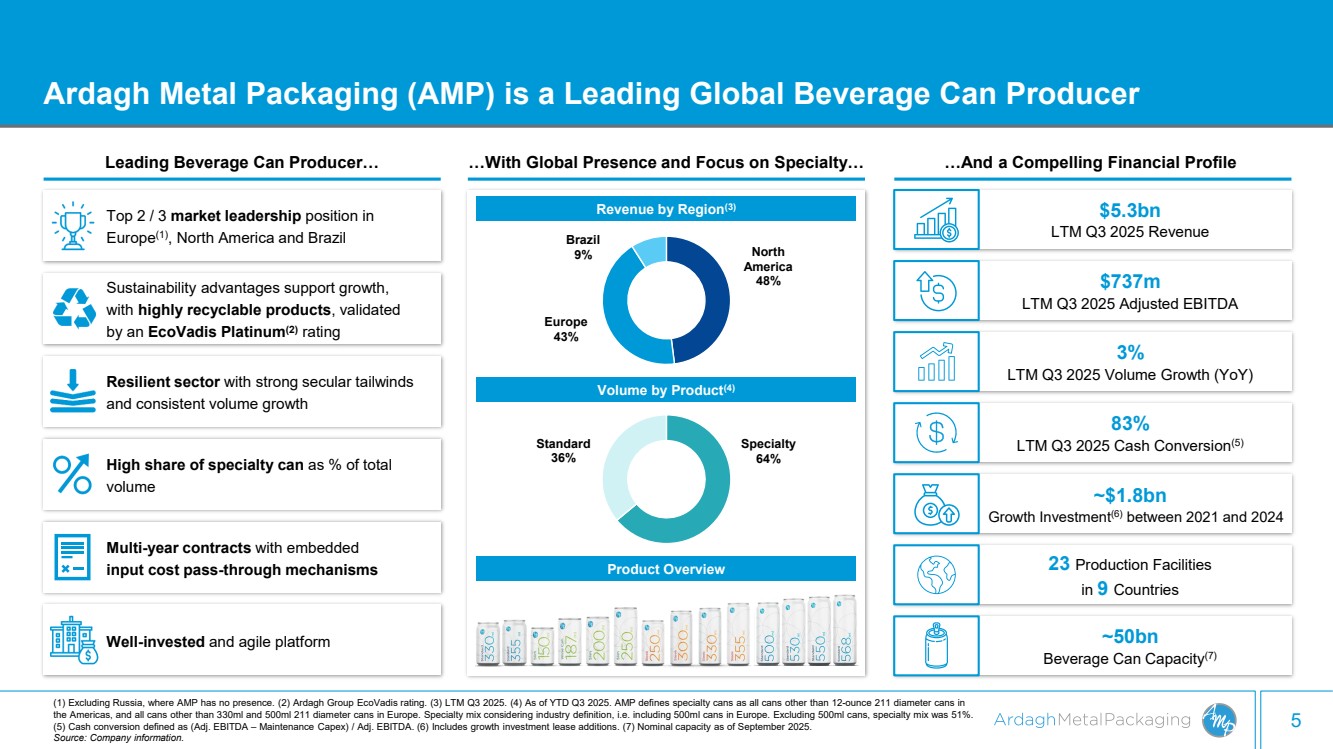
| 5 Ardagh Metal Packaging (AMP) is a Leading Global Beverage Can Producer (1) Excluding Russia, where AMP has no presence. (2) Ardagh Group EcoVadis rating. (3) LTM Q3 2025. (4) As of YTD Q3 2025. AMP defines specialty cans as all cans other than 12-ounce 211 diameter cans in the Americas, and all cans other than 330ml and 500ml 211 diameter cans in Europe. Specialty mix considering industry definition, i.e. including 500ml cans in Europe. Excluding 500ml cans, specialty mix was 51%. (5) Cash conversion defined as (Adj. EBITDA – Maintenance Capex) / Adj. EBITDA. (6) Includes growth investment lease additions. (7) Nominal capacity as of September 2025. Source: Company information. …And a Compelling Financial Profile ~$1.8bn Growth Investment(6) between 2021 and 2024 ~50bn Beverage Can Capacity(7) 23 Production Facilities in 9 Countries 3% LTM Q3 2025 Volume Growth (YoY) $5.3bn LTM Q3 2025 Revenue $737m LTM Q3 2025 Adjusted EBITDA 83% LTM Q3 2025 Cash Conversion(5) Leading Beverage Can Producer… …With Global Presence and Focus on Specialty… North America 48% Europe 43% Brazil 9% Specialty 64% Standard 36% Revenue by Region(3) Volume by Product(4) Top 2 / 3 market leadership position in Europe(1), North America and Brazil Sustainability advantages support growth, with highly recyclable products, validated by an EcoVadis Platinum(2) rating Resilient sector with strong secular tailwinds and consistent volume growth High share of specialty can as % of total volume Well-invested and agile platform Multi-year contracts with embedded input cost pass-through mechanisms Product Overview |
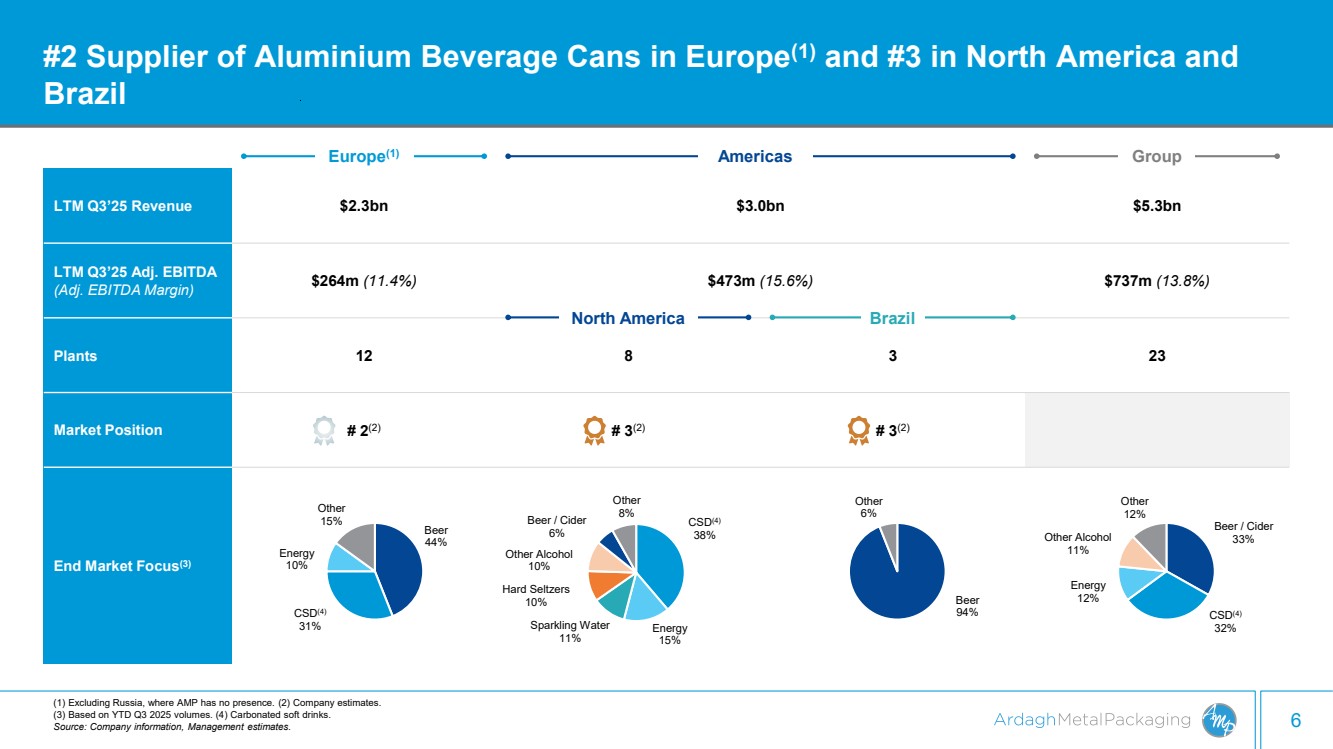
| 6 #2 Supplier of Aluminium Beverage Cans in Europe(1) and #3 in North America and Brazil LTM Q3’25 Revenue $2.3bn $3.0bn $5.3bn LTM Q3’25 Adj. EBITDA (Adj. EBITDA Margin) $264m (11.4%) $473m (15.6%) $737m (13.8%) Plants 12 8 3 23 Market Position # 2(2) # 3(2) # 3(2) End Market Focus(3) Europe(1) Americas Group Beer 94% Other 6% Beer 44% CSD(4) 31% Energy 10% Other 15% Beer / Cider 33% CSD(4) 32% Energy 12% Other Alcohol 11% Other 12% North America Brazil (1) Excluding Russia, where AMP has no presence. (2) Company estimates. (3) Based on YTD Q3 2025 volumes. (4) Carbonated soft drinks. Source: Company information, Management estimates. CSD(4) 38% Energy 15% Sparkling Water 11% Hard Seltzers 10% Other Alcohol 10% Beer / Cider 6% Other 8% |
| 2. Key Investment Highlights |
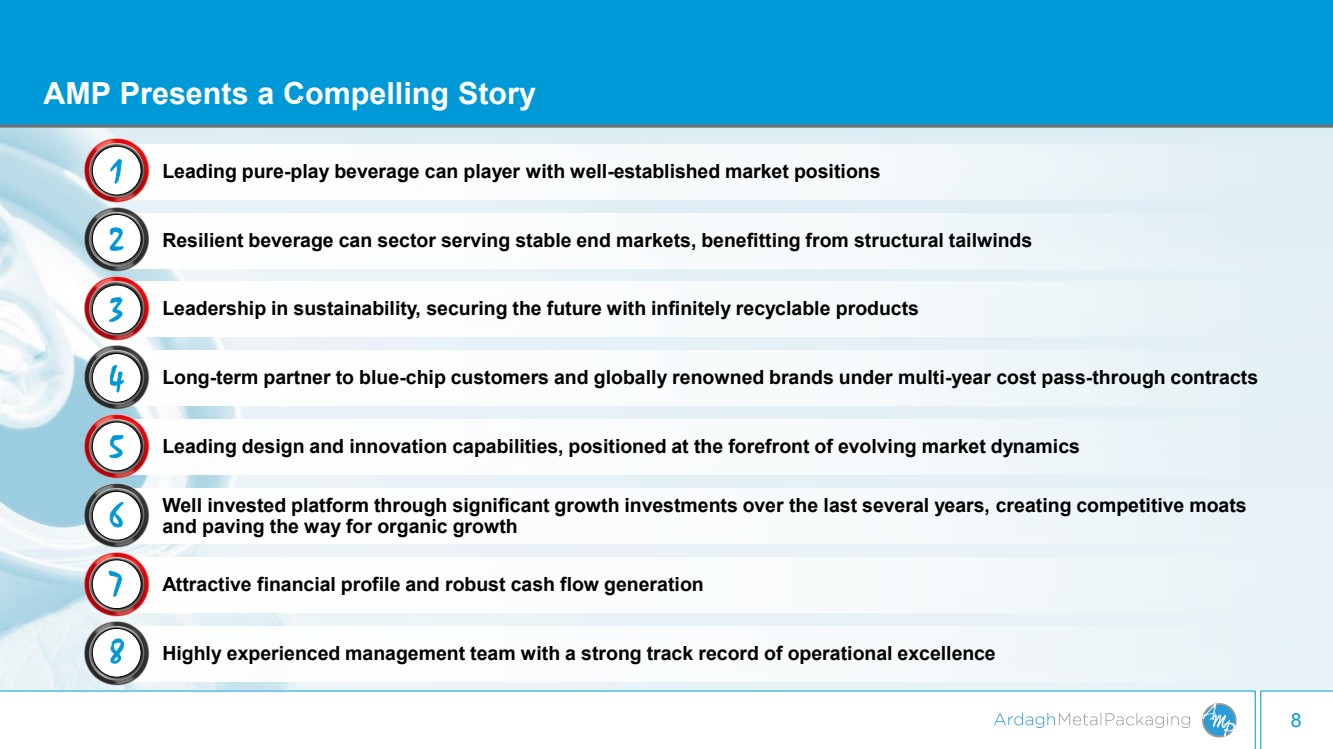
| 8 AMP Presents a Compelling Story 1 Leading pure-play beverage can player with well-established market positions 2 Resilient beverage can sector serving stable end markets, benefitting from structural tailwinds 4 Long-term partner to blue-chip customers and globally renowned brands under multi-year cost pass-through contracts Attractive financial profile and robust cash flow generation Highly experienced management team with a strong track record of operational excellence 7 Well invested platform through significant growth investments over the last several years, creating competitive moats and paving the way for organic growth 3 Leadership in sustainability, securing the future with infinitely recyclable products 5 Leading design and innovation capabilities, positioned at the forefront of evolving market dynamics 6 8 |
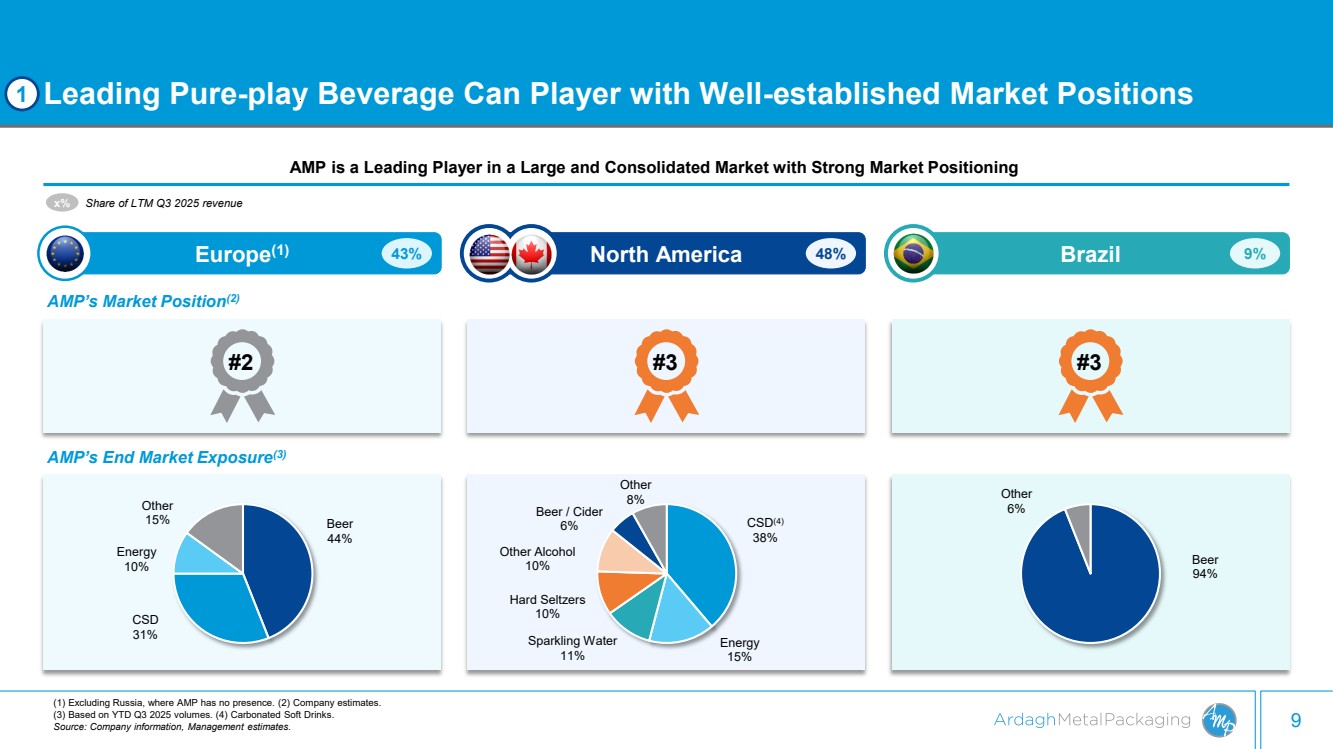
| 9 Beer 44% CSD 31% Energy 10% Other 15% Beer 94% Other 6% Europe(1) North America 1 Leading Pure-play Beverage Can Player with Well-established Market Positions AMP is a Leading Player in a Large and Consolidated Market with Strong Market Positioning #2 #3 #3 AMP’s Market Position(2) 43% x% Share of LTM Q3 2025 revenue 48% Brazil 9% AMP’s End Market Exposure(3) CSD(4) 38% Energy 15% Sparkling Water 11% Hard Seltzers 10% Other Alcohol 10% Beer / Cider 6% Other 8% (1) Excluding Russia, where AMP has no presence. (2) Company estimates. (3) Based on YTD Q3 2025 volumes. (4) Carbonated Soft Drinks. Source: Company information, Management estimates. |
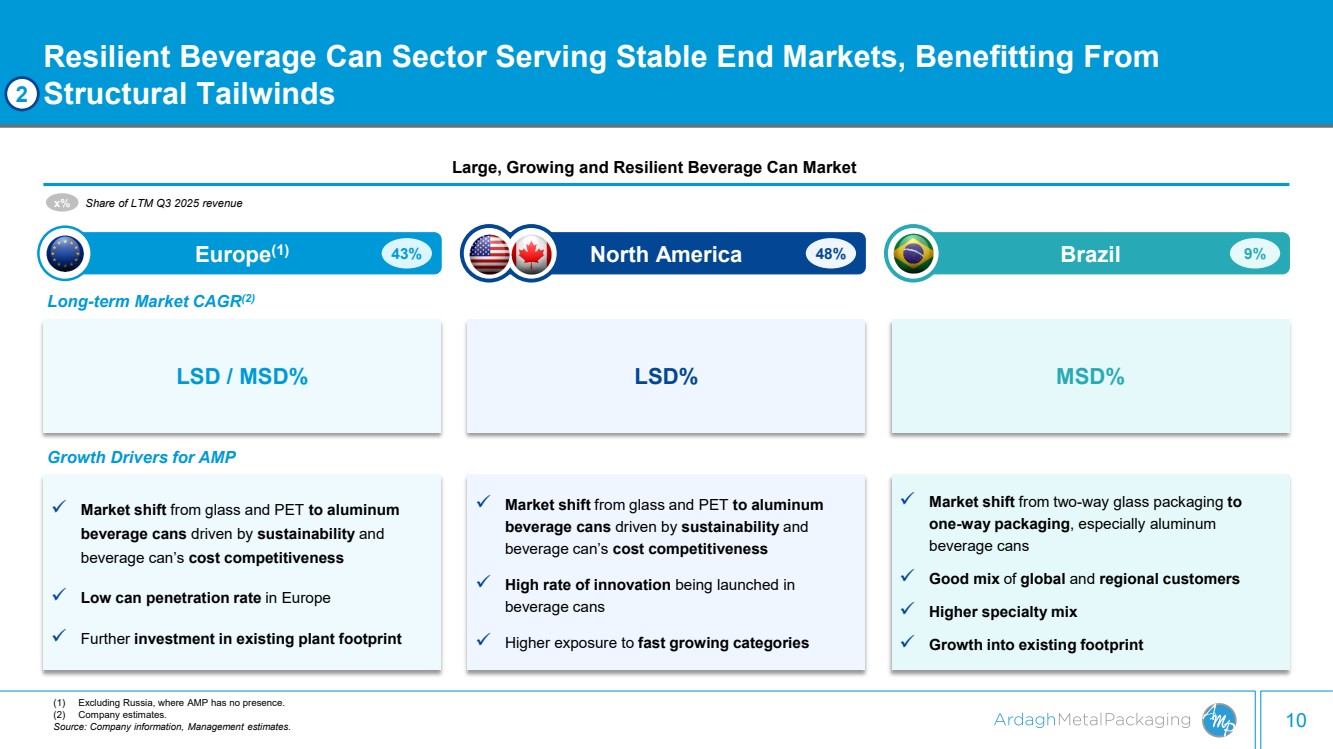
| 10 ✓ Market shift from glass and PET to aluminum beverage cans driven by sustainability and beverage can’s cost competitiveness ✓ High rate of innovation being launched in beverage cans ✓ Higher exposure to fast growing categories ✓ Market shift from two-way glass packaging to one-way packaging, especially aluminum beverage cans ✓ Good mix of global and regional customers ✓ Higher specialty mix ✓ Growth into existing footprint ✓ Market shift from glass and PET to aluminum beverage cans driven by sustainability and beverage can’s cost competitiveness ✓ Low can penetration rate in Europe ✓ Further investment in existing plant footprint LSD% MSD% Europe(1) North America Resilient Beverage Can Sector Serving Stable End Markets, Benefitting From Structural Tailwinds (1) Excluding Russia, where AMP has no presence. (2) Company estimates. Source: Company information, Management estimates. 2 Large, Growing and Resilient Beverage Can Market LSD / MSD% Long-term Market CAGR(2) 43% x% Share of LTM Q3 2025 revenue 48% Brazil 9% Growth Drivers for AMP |
| 11 3 Leadership in Sustainability, Securing the Future with Infinitely Recyclable Products Increased use of beverage cans enables AMP’s customers to achieve their decarbonization targets, supporting market resilience Beverage Cans Have the Highest Recycling Rate… ✓ Aluminum beverage cans have the highest global recycling rate ✓ Customers are committed to environmental targets and decarbonization B ratings for Climate Change and Water Management, and an A rating for Supplier Engagement from global not-for-profit CDP Awarded a Platinum rating(3) by EcoVadis for Sustainability ...and Are Gaining Market Share… 0% 10% 20% 30% 40% 50% 60% 70% US Brazil Europe 2022 2023 2024 Beverage cans as an overall % of beverage packaging market(2) (1) Eunomia 2025 market study. (2) Based on NielsenIQ data. (3) Ardagh Group EcoVadis rating. Source: Company information, Eunomia Global Beverage Recycling market report, Nielsen IQ. 0% 10% 20% 30% 40% 50% 60% 70% US Brazil Europe 2022 2023 2024 Non-alcoholic drinks Alcoholic drinks +130bps +110bps +80bps +190bps +150bps +210bps 41.9% 47.0% 74.8% Glass Bottles PET Bottles Aluminum Cans Global recycling rates, as of 2025(1) …with AMP's Sustainability Leadership, Well Recognized |

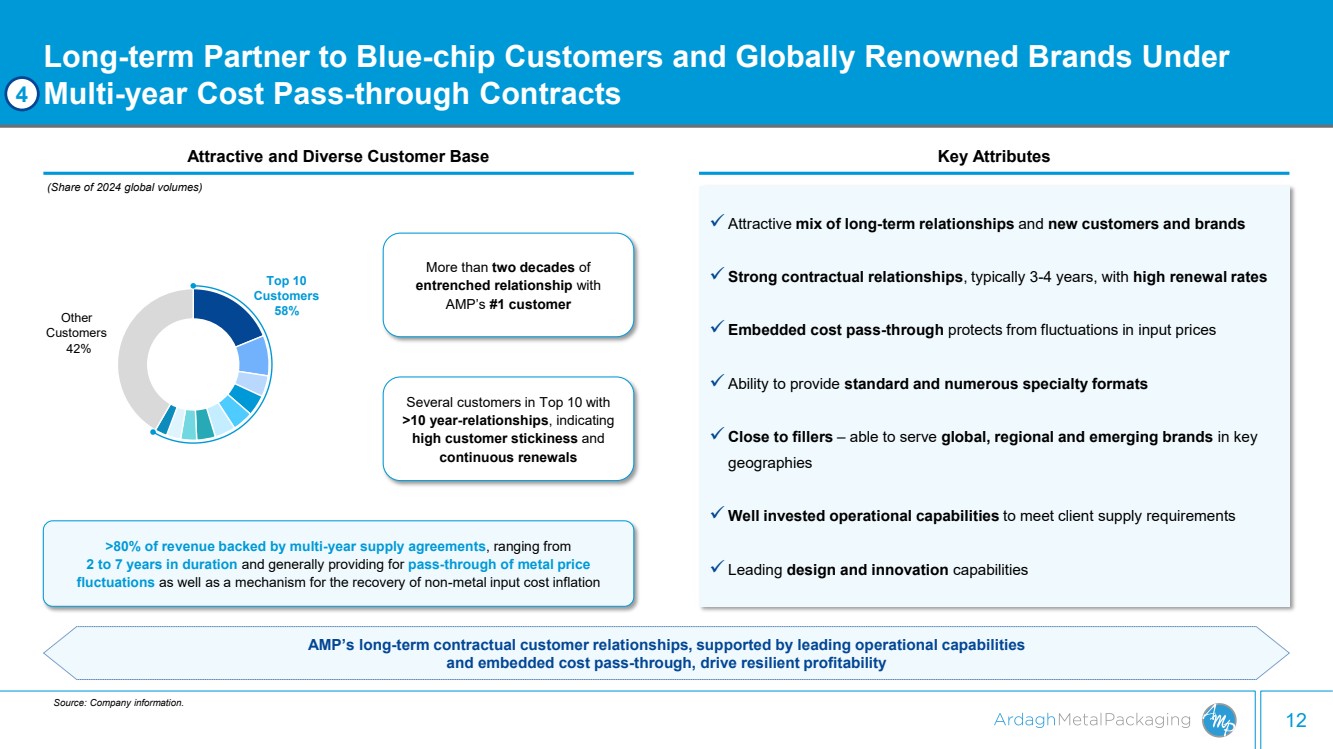
| 12 Long-term Partner to Blue-chip Customers and Globally Renowned Brands Under Multi-year Cost Pass-through Contracts Source: Company information. AMP’s diverse, global customer base offers high potential to grow organically and capture adjacencies catering to novel customer trends Attractive and Diverse Customer Base Key Attributes ✓ Attractive mix of long-term relationships and new customers and brands ✓ Strong contractual relationships, typically 3-4 years, with high renewal rates ✓ Embedded cost pass-through protects from fluctuations in input prices ✓ Ability to provide standard and numerous specialty formats ✓ Close to fillers – able to serve global, regional and emerging brands in key geographies ✓ Well invested operational capabilities to meet client supply requirements ✓ Leading design and innovation capabilities 4 >80% of revenue backed by multi-year supply agreements, ranging from 2 to 7 years in duration and generally providing for pass-through of metal price fluctuations as well as a mechanism for the recovery of non-metal input cost inflation More than two decades of entrenched relationship with AMP’s #1 customer Several customers in Top 10 with >10 year-relationships, indicating high customer stickiness and continuous renewals (Share of 2024 global volumes) 42% Other Customers Top 10 Customers 58% AMP’s long-term contractual customer relationships, supported by leading operational capabilities and embedded cost pass-through, drive resilient profitability |
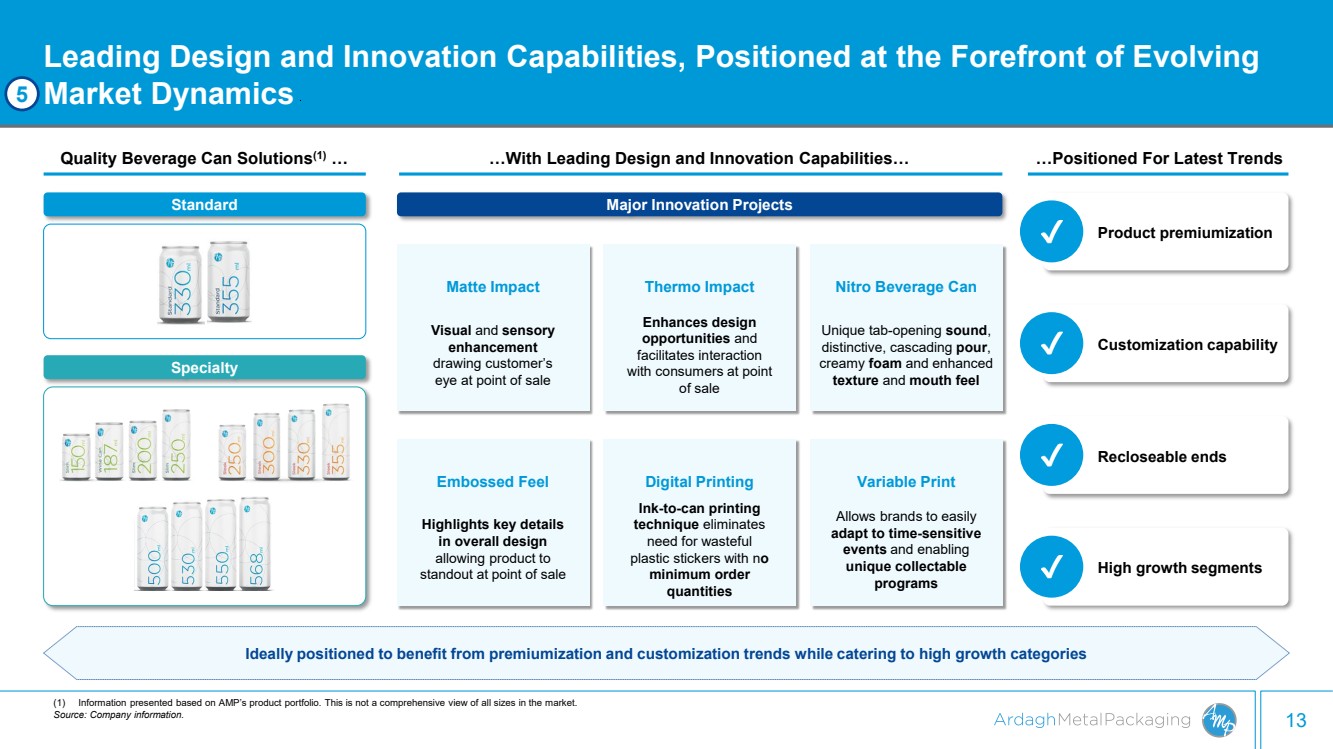
| 13 Leading Design and Innovation Capabilities, Positioned at the Forefront of Evolving Market Dynamics Quality Beverage Can Solutions(1) … …With Leading Design and Innovation Capabilities… Major Innovation Projects Ideally positioned to benefit from premiumization and customization trends while catering to high growth categories Nitro Beverage Can Unique tab-opening sound, distinctive, cascading pour, creamy foam and enhanced texture and mouth feel Matte Impact Visual and sensory enhancement drawing customer’s eye at point of sale Thermo Impact Enhances design opportunities and facilitates interaction with consumers at point of sale Variable Print Allows brands to easily adapt to time-sensitive events and enabling unique collectable programs Embossed Feel Highlights key details in overall design allowing product to standout at point of sale Digital Printing Ink-to-can printing technique eliminates need for wasteful plastic stickers with no minimum order quantities (1) Information presented based on AMP’s product portfolio. This is not a comprehensive view of all sizes in the market. Source: Company information. 5 Specialty Standard …Positioned For Latest Trends Product premiumization Customization capability Recloseable ends High growth segments |
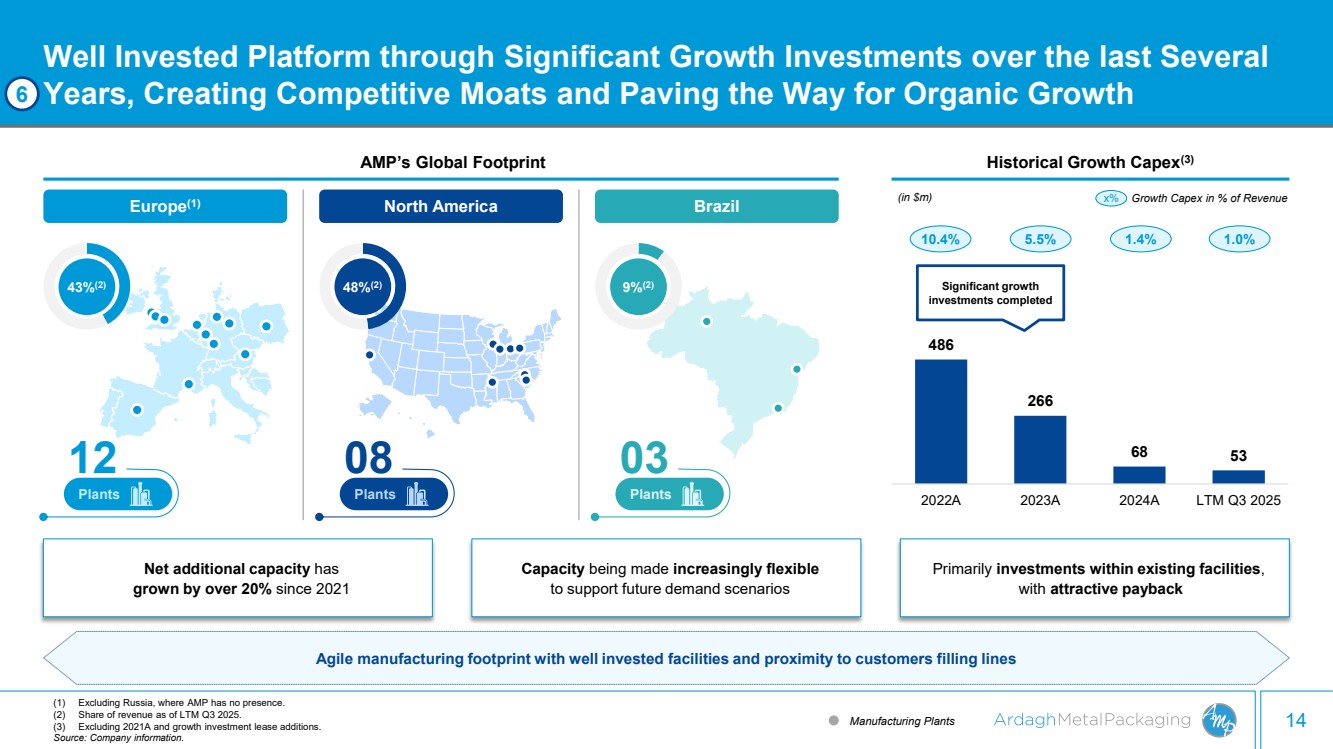
| 14 Well Invested Platform through Significant Growth Investments over the last Several Years, Creating Competitive Moats and Paving the Way for Organic Growth Agile manufacturing footprint with well invested facilities and proximity to customers filling lines Europe(1) North America Brazil 43%(2) 48%(2) Plants 08 9%(2) Plants 03 Manufacturing Plants (1) Excluding Russia, where AMP has no presence. (2) Share of revenue as of LTM Q3 2025. (3) Excluding 2021A and growth investment lease additions. Source: Company information. Plants 12 Net additional capacity has grown by over 20% since 2021 Capacity being made increasingly flexible to support future demand scenarios Primarily investments within existing facilities, with attractive payback 6 AMP’s Global Footprint Historical Growth Capex(3) 486 266 68 53 2022A 2023A 2024A LTM Q3 2025 10.4% 5.5% 1.4% 1.0% x% Growth Capex in % of Revenue Significant growth investments completed (in $m) |
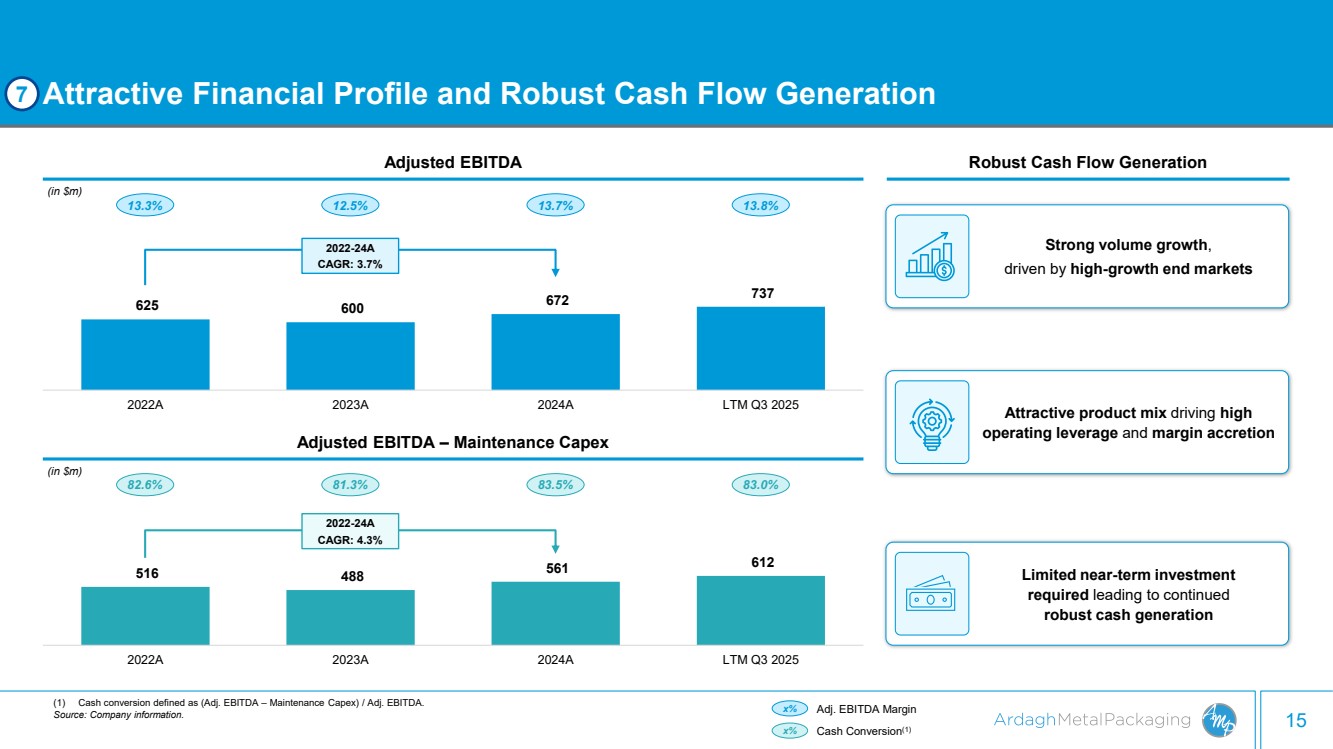
| 15 516 488 561 612 2022A 2023A 2024A LTM Q3 2025 (1) Cash conversion defined as (Adj. EBITDA – Maintenance Capex) / Adj. EBITDA. Source: Company information. Attractive Financial Profile and Robust Cash Flow Generation 625 600 672 737 2022A 2023A 2024A LTM Q3 2025 13.3% 12.5% 13.7% 13.8% Adjusted EBITDA (in $m) x% Adjusted EBITDA – Maintenance Capex (in $m) x% Adj. EBITDA Margin Cash Conversion(1) 82.6% 81.3% 83.5% 83.0% Robust Cash Flow Generation 2022-24A CAGR: 3.7% Limited near-term investment required leading to continued robust cash generation 7 2022-24A CAGR: 4.3% Strong volume growth, driven by high-growth end markets Attractive product mix driving high operating leverage and margin accretion |
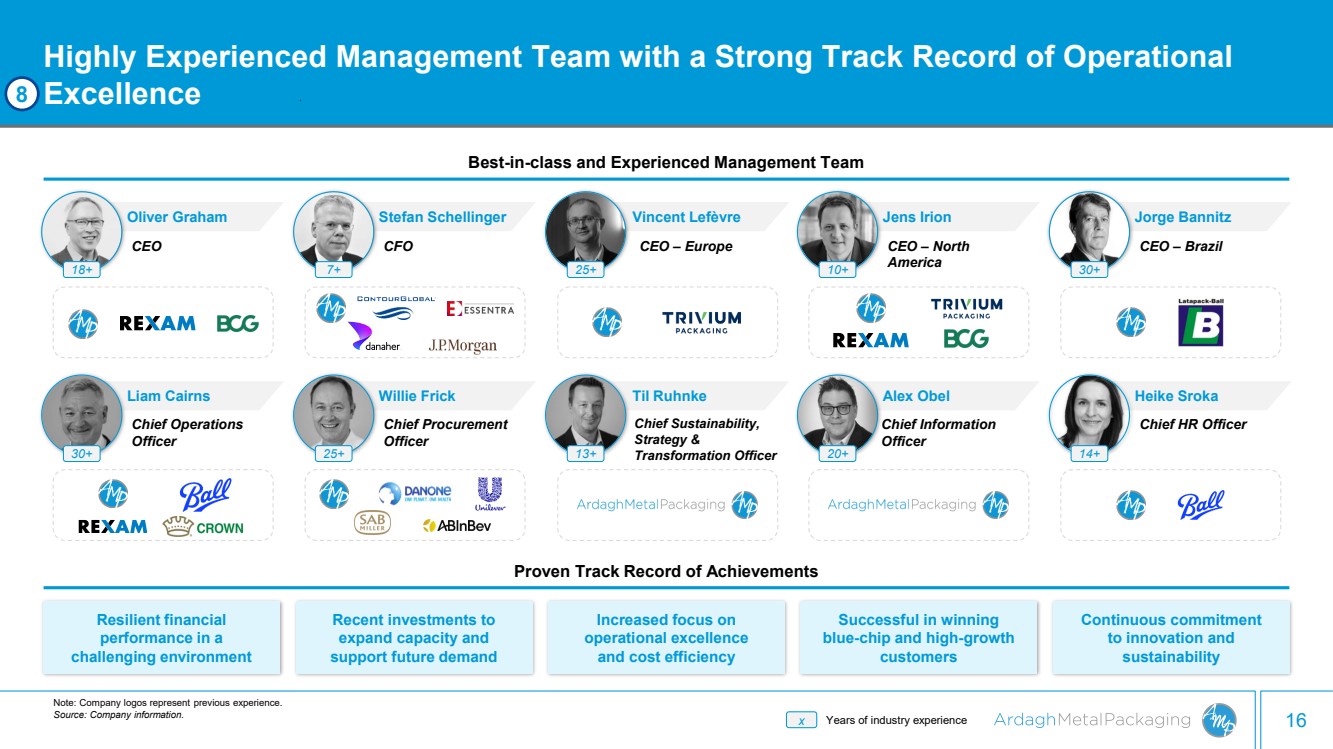
| 16 Best-in-class and Experienced Management Team Chief Sustainability, Strategy & Transformation Officer Highly Experienced Management Team with a Strong Track Record of Operational Excellence Proven Track Record of Achievements x Years of industry experience Resilient financial performance in a challenging environment Recent investments to expand capacity and support future demand Increased focus on operational excellence and cost efficiency Continuous commitment to innovation and sustainability Successful in winning blue-chip and high-growth customers Note: Company logos represent previous experience. Source: Company information. 8 Liam Cairns Oliver Graham Chief Operations Officer CEO 18+ 30+ Willie Frick Stefan Schellinger CFO Chief Procurement Officer 7+ 25+ Til Ruhnke CEO – Europe Vincent Lefèvre 25+ 13+ Alex Obel Jens Irion CEO – North America Chief Information Officer 10+ 20+ Heike Sroka Jorge Bannitz CEO – Brazil Chief HR Officer 30+ 14+ |
| 3. Historical Financials |

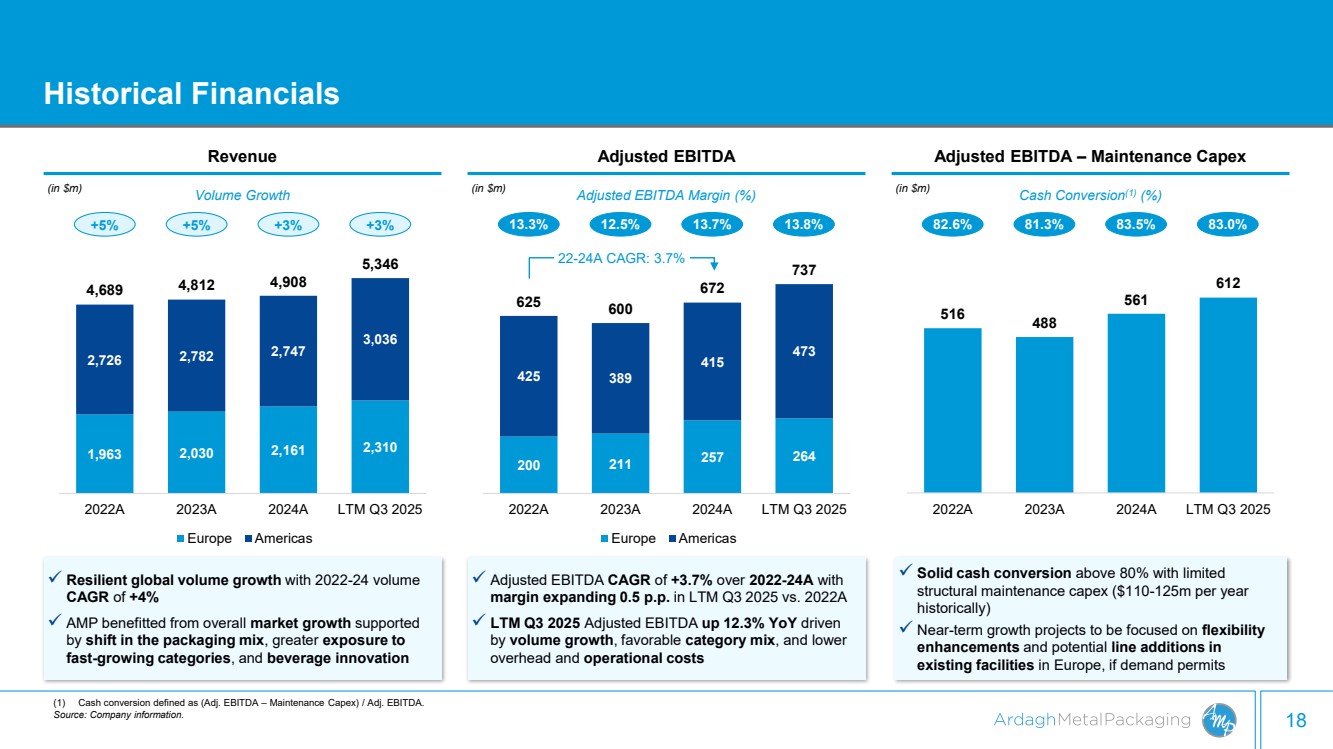
| 18 Historical Financials Revenue Adjusted EBITDA – Maintenance Capex 1,963 2,030 2,161 2,310 2,726 2,782 2,747 3,036 4,689 4,812 4,908 5,346 2022A 2023A 2024A LTM Q3 2025 Europe Americas ✓ Resilient global volume growth with 2022-24 volume CAGR of +4% ✓ AMP benefitted from overall market growth supported by shift in the packaging mix, greater exposure to fast-growing categories, and beverage innovation ✓ Adjusted EBITDA CAGR of +3.7% over 2022-24A with margin expanding 0.5 p.p. in LTM Q3 2025 vs. 2022A ✓ LTM Q3 2025 Adjusted EBITDA up 12.3% YoY driven by volume growth, favorable category mix, and lower overhead and operational costs ✓ Solid cash conversion above 80% with limited structural maintenance capex ($110-125m per year historically) ✓ Near-term growth projects to be focused on flexibility enhancements and potential line additions in existing facilities in Europe, if demand permits 200 211 257 264 425 389 415 473 625 600 672 737 2022A 2023A 2024A LTM Q3 2025 Europe Americas Adjusted EBITDA 13.3% 12.5% 13.7% Adjusted EBITDA Margin (%) 516 488 561 612 2022A 2023A 2024A LTM Q3 2025 Cash Conversion(1) (%) (in $m) (in $m) +5% +5% +3% Volume Growth +3% 13.8% 22-24A CAGR: 3.7% 82.6% 81.3% 83.5% 83.0% (in $m) (1) Cash conversion defined as (Adj. EBITDA – Maintenance Capex) / Adj. EBITDA. Source: Company information. |
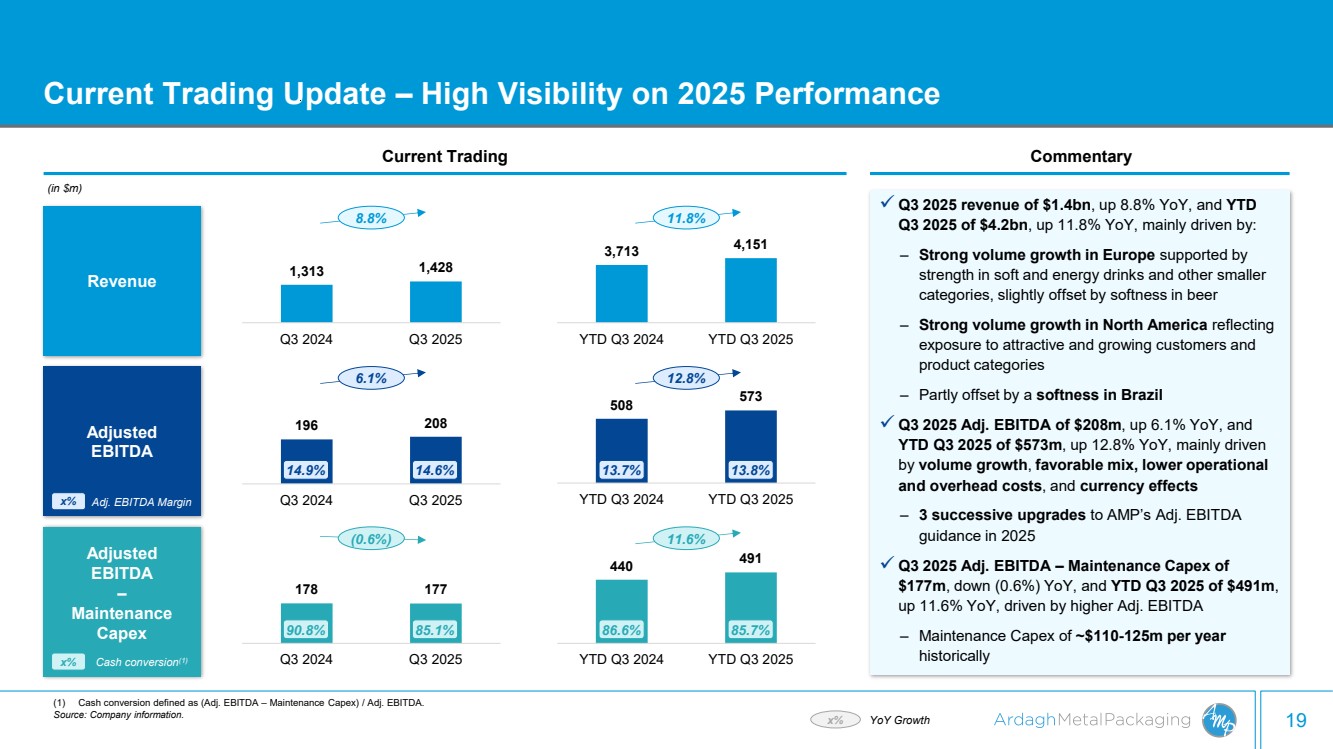
| 19 178 177 Q3 2024 Q3 2025 440 491 YTD Q3 2024 YTD Q3 2025 196 208 Q3 2024 Q3 2025 508 573 YTD Q3 2024 YTD Q3 2025 1,313 1,428 Q3 2024 Q3 2025 3,713 4,151 YTD Q3 2024 YTD Q3 2025 Current Trading Update – High Visibility on 2025 Performance ✓ Q3 2025 revenue of $1.4bn, up 8.8% YoY, and YTD Q3 2025 of $4.2bn, up 11.8% YoY, mainly driven by: ‒ Strong volume growth in Europe supported by strength in soft and energy drinks and other smaller categories, slightly offset by softness in beer ‒ Strong volume growth in North America reflecting exposure to attractive and growing customers and product categories ‒ Partly offset by a softness in Brazil ✓ Q3 2025 Adj. EBITDA of $208m, up 6.1% YoY, and YTD Q3 2025 of $573m, up 12.8% YoY, mainly driven by volume growth, favorable mix, lower operational and overhead costs, and currency effects ‒ 3 successive upgrades to AMP’s Adj. EBITDA guidance in 2025 ✓ Q3 2025 Adj. EBITDA – Maintenance Capex of $177m, down (0.6%) YoY, and YTD Q3 2025 of $491m, up 11.6% YoY, driven by higher Adj. EBITDA ‒ Maintenance Capex of ~$110-125m per year historically Current Trading Revenue Adjusted EBITDA Adjusted EBITDA – Maintenance Capex 6.1% 12.8% 8.8% x% YoY Growth x% Adj. EBITDA Margin 13.7% 13.8% Commentary (0.6%) 11.6% (in $m) (1) Cash conversion defined as (Adj. EBITDA – Maintenance Capex) / Adj. EBITDA. Source: Company information. 14.9% 14.6% 11.8% x% Cash conversion(1) 90.8% 85.1% 86.6% 85.7% |
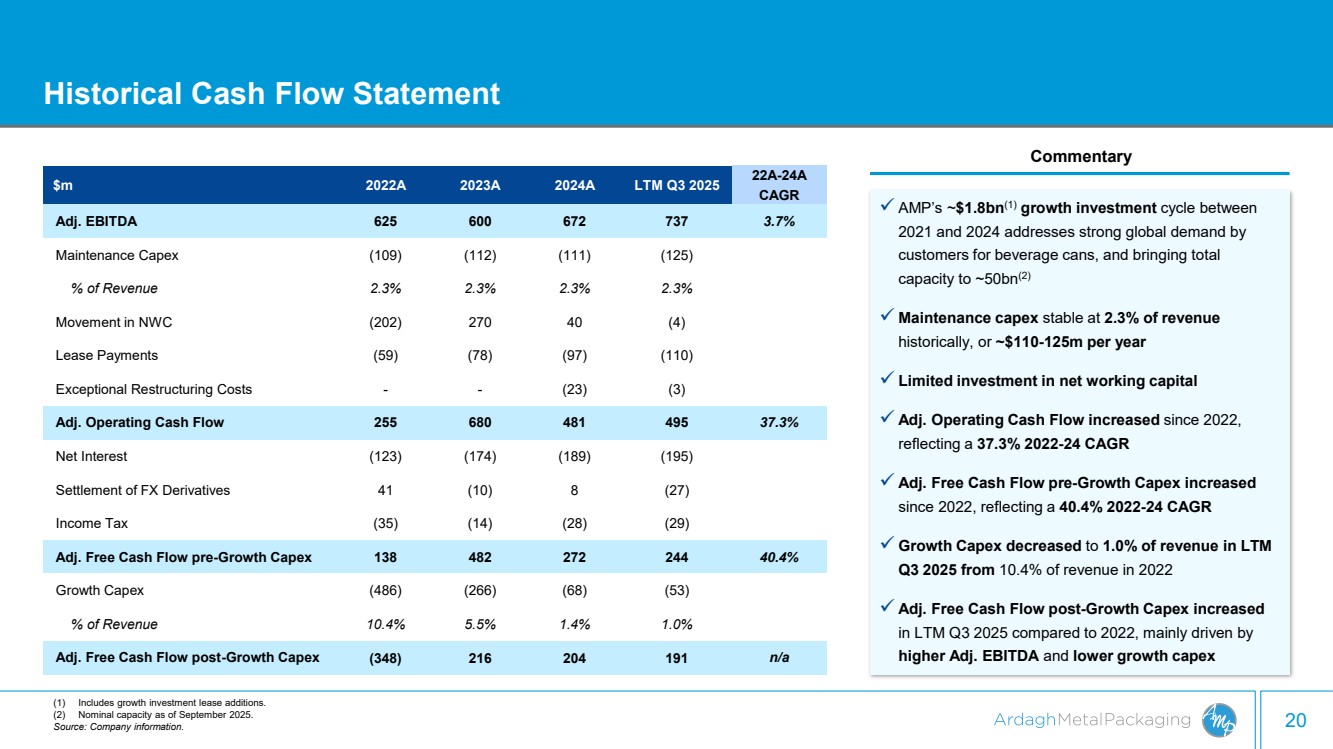
| 20 Historical Cash Flow Statement ✓ AMP’s ~$1.8bn(1) growth investment cycle between 2021 and 2024 addresses strong global demand by customers for beverage cans, and bringing total capacity to ~50bn(2) ✓ Maintenance capex stable at 2.3% of revenue historically, or ~$110-125m per year ✓ Limited investment in net working capital ✓ Adj. Operating Cash Flow increased since 2022, reflecting a 37.3% 2022-24 CAGR ✓ Adj. Free Cash Flow pre-Growth Capex increased since 2022, reflecting a 40.4% 2022-24 CAGR ✓ Growth Capex decreased to 1.0% of revenue in LTM Q3 2025 from 10.4% of revenue in 2022 ✓ Adj. Free Cash Flow post-Growth Capex increased in LTM Q3 2025 compared to 2022, mainly driven by higher Adj. EBITDA and lower growth capex $m 2022A 2023A 2024A LTM Q3 2025 22A-24A CAGR Adj. EBITDA 625 600 672 737 3.7% Maintenance Capex (109) (112) (111) (125) % of Revenue 2.3% 2.3% 2.3% 2.3% Movement in NWC (202) 270 40 (4) Lease Payments (59) (78) (97) (110) Exceptional Restructuring Costs - - (23) (3) Adj. Operating Cash Flow 255 680 481 495 37.3% Net Interest (123) (174) (189) (195) Settlement of FX Derivatives 41 (10) 8 (27) Income Tax (35) (14) (28) (29) Adj. Free Cash Flow pre-Growth Capex 138 482 272 244 40.4% Growth Capex (486) (266) (68) (53) % of Revenue 10.4% 5.5% 1.4% 1.0% Adj. Free Cash Flow post-Growth Capex (348) 216 204 191 n/a Commentary (1) Includes growth investment lease additions. (2) Nominal capacity as of September 2025. Source: Company information. |
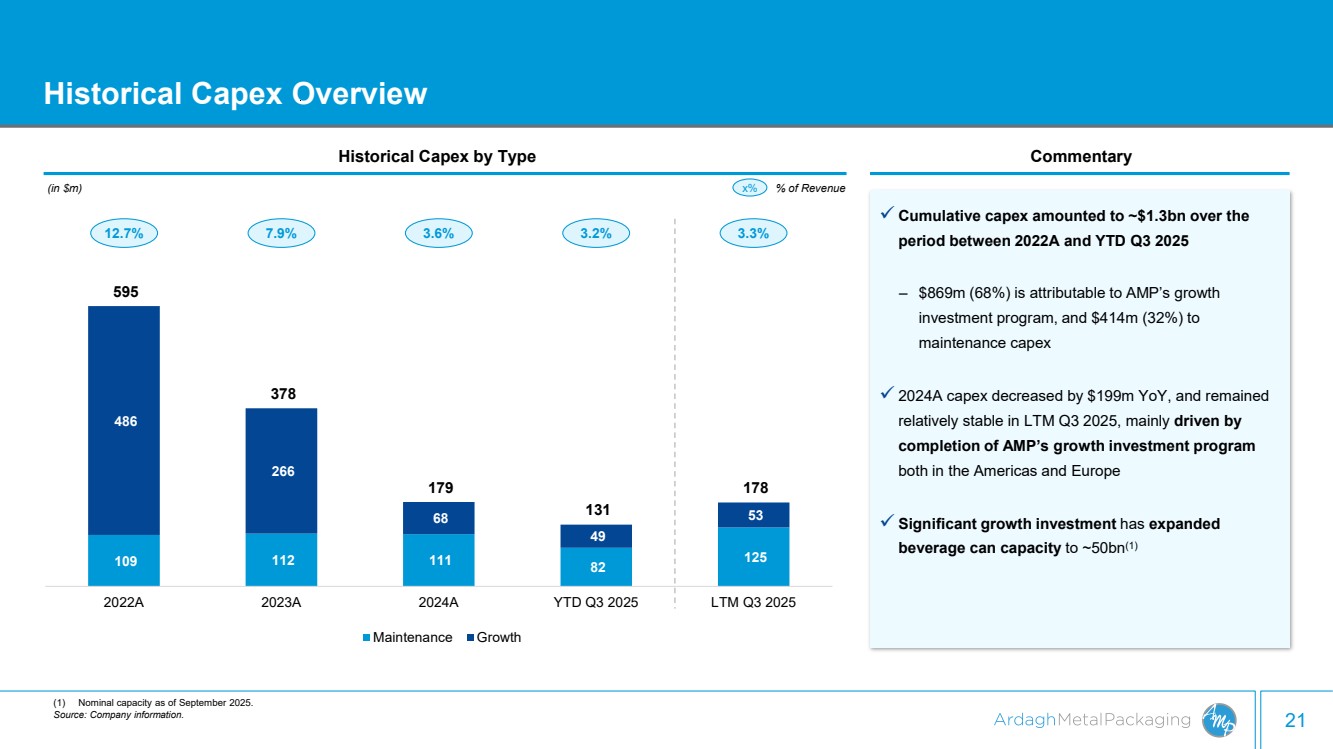
| 21 Historical Capex Overview 109 112 111 82 125 486 266 68 49 53 595 378 179 131 178 2022A 2023A 2024A YTD Q3 2025 LTM Q3 2025 Maintenance Growth ✓ Cumulative capex amounted to ~$1.3bn over the period between 2022A and YTD Q3 2025 ‒ $869m (68%) is attributable to AMP’s growth investment program, and $414m (32%) to maintenance capex ✓ 2024A capex decreased by $199m YoY, and remained relatively stable in LTM Q3 2025, mainly driven by completion of AMP’s growth investment program both in the Americas and Europe ✓ Significant growth investment has expanded beverage can capacity to ~50bn(1) Historical Capex by Type Commentary (in $m) 12.7% 7.9% 3.6% 3.3% x% % of Revenue (1) Nominal capacity as of September 2025. Source: Company information. 3.2% |
| 22 Leading pure-play beverage can player with well-established market positions Resilient beverage can sector serving stable end markets, benefitting from structural tailwinds Long-term partner to blue-chip customers and globally renowned brands under multi-year cost pass-through contracts Attractive financial profile and robust cash flow generation Leadership in sustainability, securing the future with infinitely recyclable products Well invested platform through significant growth investments over the last several years, creating competitive moats and paving the way for organic growth Leading design and innovation capabilities, positioned at the forefront of evolving market dynamics Delivering on Our Story 1 3 5 7 6 2 4 (1) Excluding Russia, where AMP has no presence. (2) Includes growth investment lease additions. (3) Cash conversion defined as (Adj. EBITDA – Maintenance Capex) / Adj. EBITDA. Source: Company information. ✓ #2 supplier of aluminum beverage cans in Europe(1) and #3 in North America and Brazil ✓ Structural tailwinds from increasing demand for customized beverage cans as brands seek to differentiate and engage customers ✓ Market shift from glass and PET to aluminum in developed markets driven by sustainability and beverage can’s cost competitiveness ✓ Strong customer base, spanning well-established global and regional customers ✓ Well positioned to capture evolving needs in fast-growing end markets such as Energy drinks ✓ Deployed $1.8bn(2) of growth investment between 2021 and 2024 ✓ Historical cash conversion rate(3) of over 80% from 2022 to LTM Q3 2025 Key Takeaways |

| 4. Appendix |
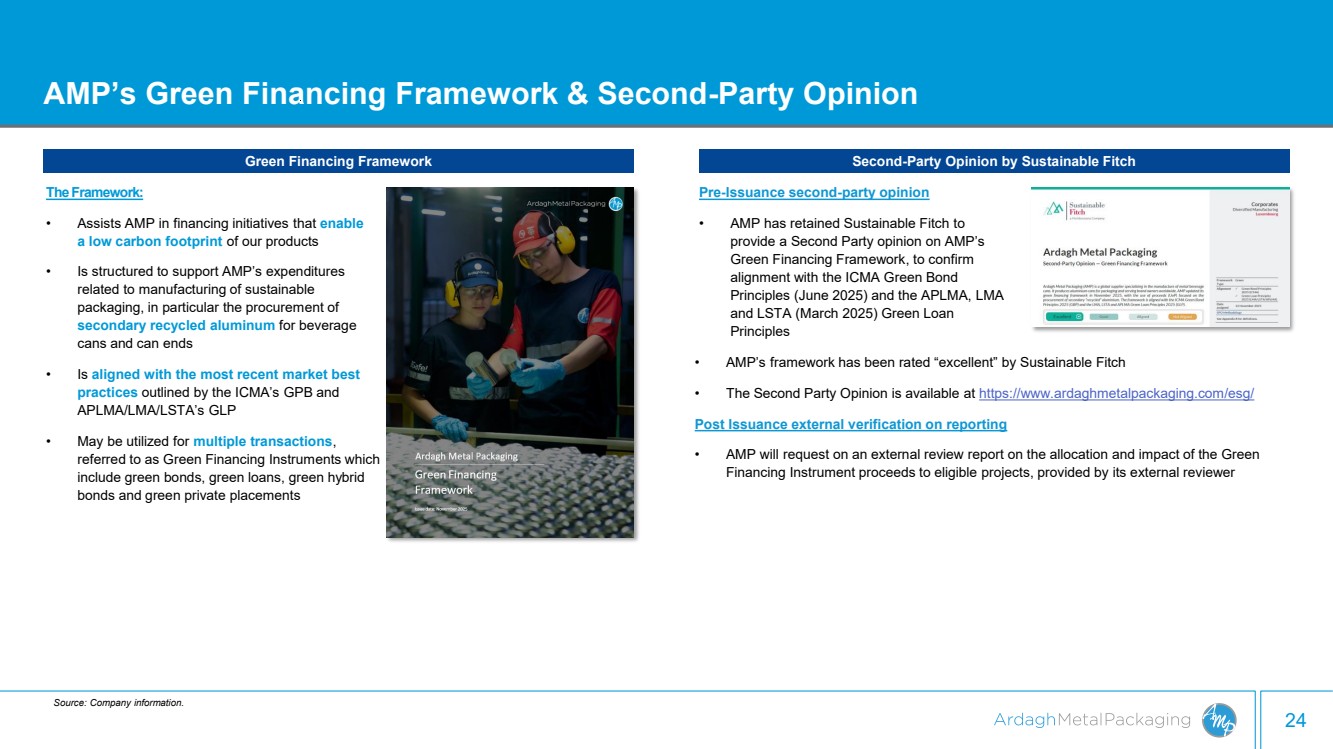
| 24 AMP’s Green Financing Framework & Second-Party Opinion The Framework: • Assists AMP in financing initiatives that enable a low carbon footprint of our products • Is structured to support AMP’s expenditures related to manufacturing of sustainable packaging, in particular the procurement of secondary recycled aluminum for beverage cans and can ends • Is aligned with the most recent market best practices outlined by the ICMA’s GPB and APLMA/LMA/LSTA’s GLP • May be utilized for multiple transactions, referred to as Green Financing Instruments which include green bonds, green loans, green hybrid bonds and green private placements Green Financing Framework Second-Party Opinion by Sustainable Fitch Pre-Issuance second-party opinion • AMP has retained Sustainable Fitch to provide a Second Party opinion on AMP’s Green Financing Framework, to confirm alignment with the ICMA Green Bond Principles (June 2025) and the APLMA, LMA and LSTA (March 2025) Green Loan Principles Source: Company information. • AMP’s framework has been rated “excellent” by Sustainable Fitch • The Second Party Opinion is available at https://www.ardaghmetalpackaging.com/esg/ Post Issuance external verification on reporting • AMP will request on an external review report on the allocation and impact of the Green Financing Instrument proceeds to eligible projects, provided by its external reviewer |
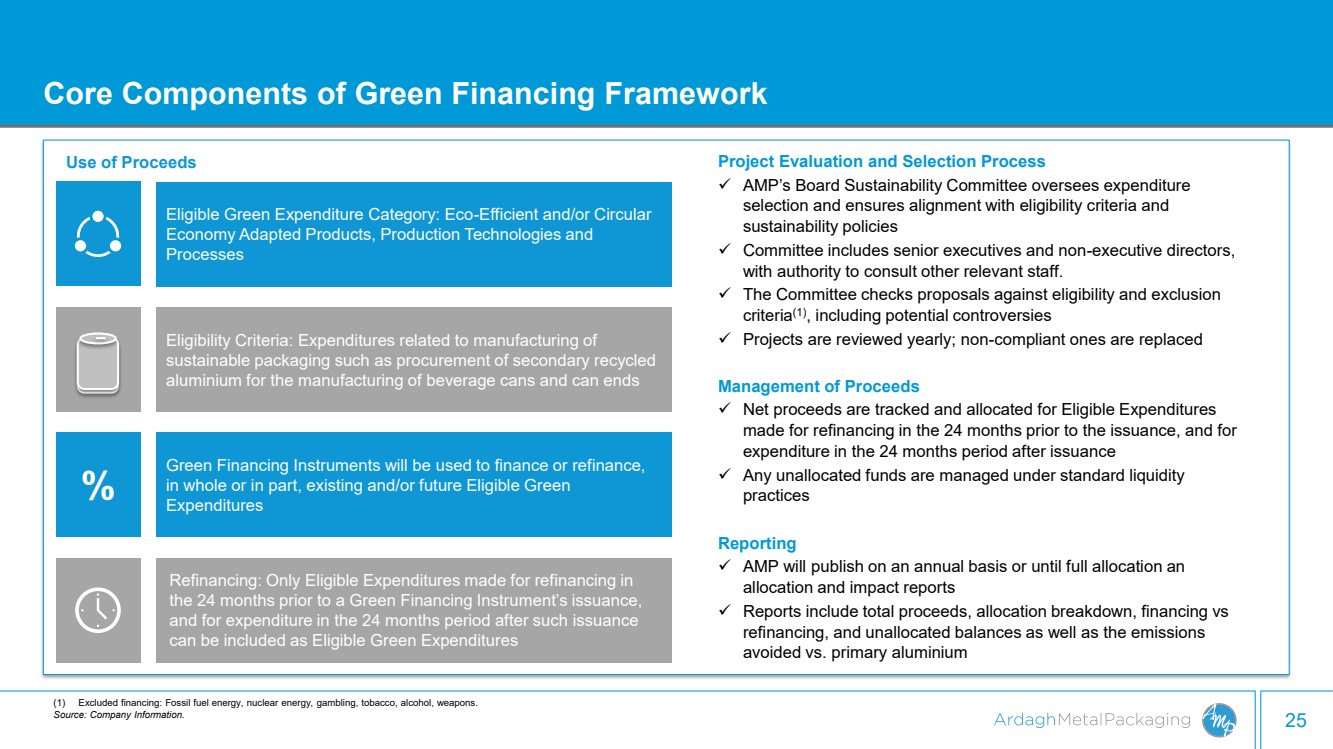
| 25 Core Components of Green Financing Framework Refinancing: Only Eligible Expenditures made for refinancing in the 24 months prior to a Green Financing Instrument’s issuance, and for expenditure in the 24 months period after such issuance can be included as Eligible Green Expenditures Project Evaluation and Selection Process ✓ AMP’s Board Sustainability Committee oversees expenditure selection and ensures alignment with eligibility criteria and sustainability policies ✓ Committee includes senior executives and non-executive directors, with authority to consult other relevant staff. ✓ The Committee checks proposals against eligibility and exclusion criteria(1), including potential controversies ✓ Projects are reviewed yearly; non-compliant ones are replaced Management of Proceeds ✓ Net proceeds are tracked and allocated for Eligible Expenditures made for refinancing in the 24 months prior to the issuance, and for expenditure in the 24 months period after issuance ✓ Any unallocated funds are managed under standard liquidity practices Reporting ✓ AMP will publish on an annual basis or until full allocation an allocation and impact reports ✓ Reports include total proceeds, allocation breakdown, financing vs refinancing, and unallocated balances as well as the emissions avoided vs. primary aluminium Use of Proceeds Eligible Green Expenditure Category: Eco-Efficient and/or Circular Economy Adapted Products, Production Technologies and Processes Eligibility Criteria: Expenditures related to manufacturing of sustainable packaging such as procurement of secondary recycled aluminium for the manufacturing of beverage cans and can ends Green Financing Instruments will be used to finance or refinance, in whole or in part, existing and/or future Eligible Green % Expenditures (1) Excluded financing: Fossil fuel energy, nuclear energy, gambling, tobacco, alcohol, weapons. Source: Company Information. |
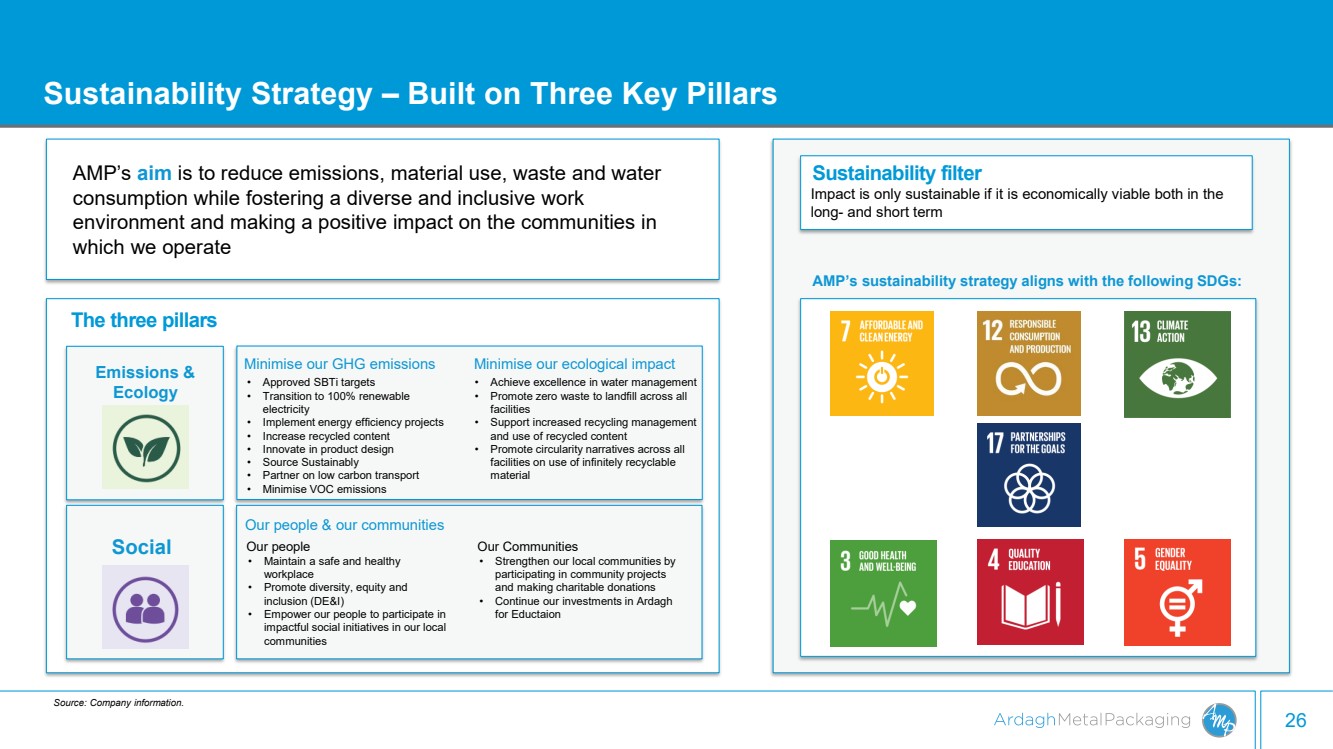
| 26 Sustainability Strategy – Built on Three Key Pillars AMP’s aim is to reduce emissions, material use, waste and water consumption while fostering a diverse and inclusive work environment and making a positive impact on the communities in which we operate The three pillars Emissions & Ecology Social Minimise our GHG emissions Minimise our ecological impact Our people & our communities • Approved SBTi targets • Transition to 100% renewable electricity • Implement energy efficiency projects • Increase recycled content • Innovate in product design • Source Sustainably • Partner on low carbon transport • Minimise VOC emissions • Achieve excellence in water management • Promote zero waste to landfill across all facilities • Support increased recycling management and use of recycled content • Promote circularity narratives across all facilities on use of infinitely recyclable material Our people • Maintain a safe and healthy workplace • Promote diversity, equity and inclusion (DE&I) • Empower our people to participate in impactful social initiatives in our local communities Our Communities • Strengthen our local communities by participating in community projects and making charitable donations • Continue our investments in Ardagh for Eductaion Sustainability filter Impact is only sustainable if it is economically viable both in the long- and short term AMP’s sustainability strategy aligns with the following SDGs: Source: Company information. |
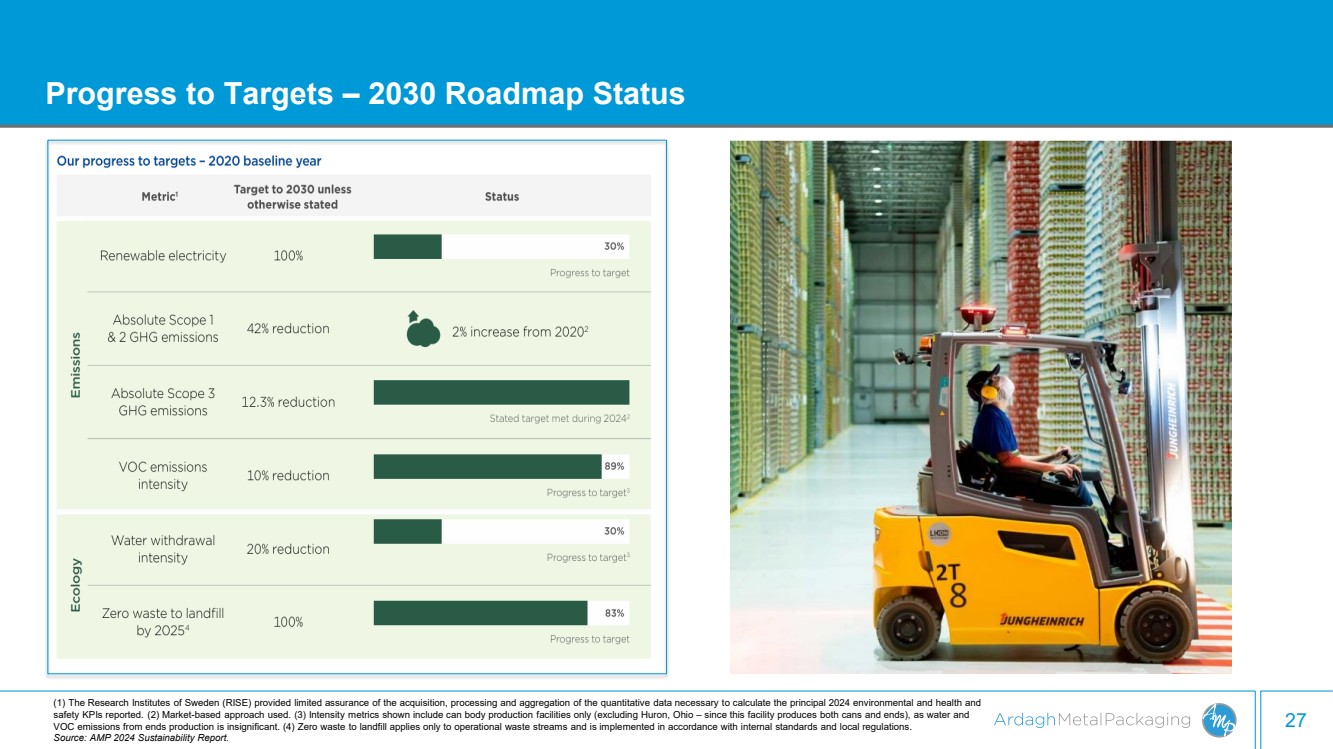
| 27 Progress to Targets – 2030 Roadmap Status (1) The Research Institutes of Sweden (RISE) provided limited assurance of the acquisition, processing and aggregation of the quantitative data necessary to calculate the principal 2024 environmental and health and safety KPIs reported. (2) Market-based approach used. (3) Intensity metrics shown include can body production facilities only (excluding Huron, Ohio – since this facility produces both cans and ends), as water and VOC emissions from ends production is insignificant. (4) Zero waste to landfill applies only to operational waste streams and is implemented in accordance with internal standards and local regulations. Source: AMP 2024 Sustainability Report. |
| Purpose |